 A few weeks ago, I was talking with an elementary school principal I know about her students’ recent test scores, which she was not happy with. The school had been paying for an expensive math curriculum and associated math prep materials for years, but her students’ math scores were not good and didn’t seem to be improving, despite adding some computer assisted learning. Her dilemma, she explained, was that her school’s teachers liked the math program and wanted to keep it going, whereas she felt that the students needed a different approach in order to make appreciable growth and get near their growth targets. So, she asked me, as an educational measurement specialist, if I and my team would check to see if there was evidence to make the call one way or the other- was the teachers’ view that the math curriculum was having an impact correct, or was her view that it wasn’t correct? Making changes would be expensive, time consuming and require a good amount of effort from the teachers and the administrators. I felt certain that we could find some answers that could help them to make the difficult decision of whether to keep the beloved math curriculum or jettison it for something that better suited their needs. The first thing we would need was evidence, and as much of it as we could get. To get us started, the principal shared with us a large amount of data in the form of math benchmarks for every student in the school, going back several years.
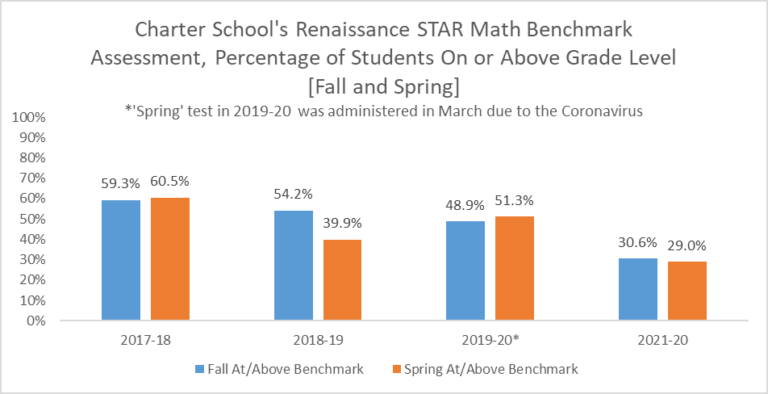
Because we knew that our findings about the curriculum could influence the school toward making costly changes, we took great care to attempt to find signs of academic growth in each grade, in each demographic group (e.g., among students with IEPs, English Language Learners, Low income students) and in the school as a whole. We examined for signs of improvement in math both state test score changes (scale scores and percentages on grade level) from year to year and Renaissance STAR benchmark tests from fall to spring (percentile scores and percentages on grade level). In almost all tested grades and demographic groups, over the four most recent years that the current curriculum was in place, we found that the students’ math skills and knowledge were falling behind. Before we shared our findings, we asked the school administrators how much training the teachers had had in the curriculum. The administrators told us that the teachers had had extensive training, including in-person professional development and small group and in-person coaching, trainings that were required by the curriculum company in order to use their product. After eliminating training as an issue, we felt certain that there was a problem resulting from a lack of fit between the organization and presentation of the particular curriculum the school was using and the math practice and skills that the students truly needed to grow. We presented our findings, along with illustrative tables and charts, to the school’s principal and the school’s board—we agreed with the principal that the curriculum should be transitioned out, and a better, more suitable curriculum should be brought in.
The decision to make substantial changes to a school’s curriculum or intervention strategies can be costly and most schools cannot afford to take them lightly or without compiling a substantial amount of evidence to back up that decision. However, not making decisions or considering how interventions are affecting student performance and growth can have very large consequences for students, in the form of lost skills and lost opportunities. Fortunately, there are many sources of student performance data that are available these days to help schools make, back up, and track the impact of those decisions. The real key is not only knowing where to look, but in knowing when to ask the question—Is this academic program really working?